About the series. September 2024, a panel of five manufacturing experts at Chortek shared strategies and tactics for exploring top-line growth while protecting the bottom line. The following is one of five articles produced as a result of that forum.
From Data to Dollars: Unlocking Profitability with Manufacturing Analytics
In today’s data-driven world, manufacturers have a goldmine of information at their fingertips, yet many aren’t fully leveraging their data to drive profitability. With the right tools, manufacturers can transform raw data into actionable insights, making it easier to boost margins, optimize processes, and make smarter business decisions.
Rick Sovitzky, a partner at Chortek who leads the outsourced accounting and advisory practice, stresses the importance of using analytics tools to maximize profitability. “Many manufacturers have the data, but they’re not using it to its full potential,” Rick explains. “With tools like Power BI, you can move beyond static reports and start analyzing real-time data to make better decisions.”
The era of sifting through outdated, manual reports is over. Tools like Microsoft Power BI and Fathom are designed to simplify data visualization and provide a clearer picture of profitability. These platforms don’t just spit out numbers—they allow users to interact with their data, drilling down into specific areas and identifying trends or outliers that impact the bottom line.
Using Data Analytics to Optimize Customer Profitability
One of the most powerful ways manufacturers can use data analytics is by focusing on customer profitability. Not all customers generate the same value for a business, and tools like Power BI help you visualize this reality. By categorizing customers into A, B, and C segments based on profitability, manufacturers can prioritize high-margin customers while making strategic decisions about the less profitable ones.
“Not every dollar is equal,” Rick points out. “By analyzing gross profit margin by customer or product, you can prioritize high-margin work and make informed decisions about pricing and production.”
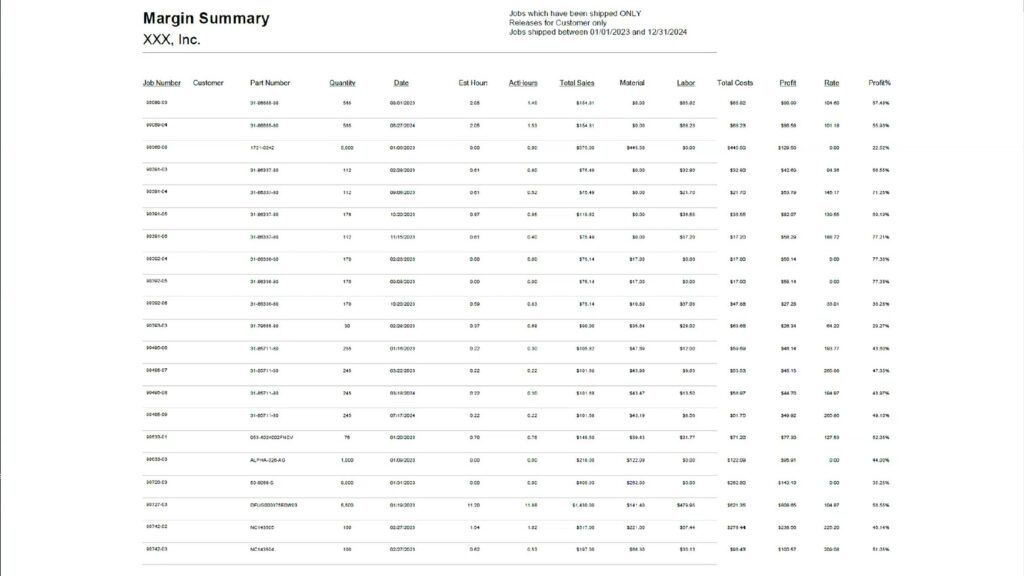
Manufacturing data in a table format.

Manufacturing data is displayed with the data visualization tool Microsoft Power BI.
For example, by reviewing historical data, a manufacturer might discover that a small subset of customers generates the majority of their profits while a large number of customers barely break even. With this insight, the company can focus on expanding relationships with the most profitable clients and either improve margins or reconsider relationships with the less profitable ones.
Real-Time, Automated Data Refreshes
Another key advantage of tools like Power BI is the automation of data refreshes. Traditional methods of data analysis often involve manually pulling reports from the ERP system at the end of the quarter or the month, delaying critical decision-making. Power BI eliminates this delay, offering real-time updates and allowing manufacturers to act quickly on any issues that arise.
“We’re not pulling information manually from the ERP system anymore,” Rick explains. “It’s happening all the time. As you click around in the Power BI dashboards, the data automatically refreshes, and you are always seeing the most up-to-date information.”
This kind of real-time visibility allows manufacturers to keep a close eye on profitability across jobs, customers, and products, identifying problems as they arise and addressing them before they escalate.
Interactive Visualization for Better Decision-Making
One of the most significant benefits of modern data analytics tools is the ability to interact with the data. In Power BI, users can adjust filters, timeframes, and variables to see how changes in one area impact the rest of the business.
“We use Power BI to break down gross profit over a specific time period and across thousands of jobs,” Rick explains. “With just a few clicks, you can analyze customer segments or see the impact of reselling versus manufacturing. The tool’s visual nature makes it easy to see patterns that wouldn’t stand out in a traditional spreadsheet.”

Manufacturing data visualized in a scatter plot.
For example, by using a scatter plot in Power BI, manufacturers can visualize the profitability of each job, clearly showing which jobs generate the highest margins and which are underperforming. With this information, they can then adjust production strategies, allocate resources more effectively, or refine their pricing models.
Predictive and Proactive Business Planning
Rick also highlights the predictive capabilities of data analytics tools. “What Power BI allows us to do is start asking the ‘why’ questions and then determine what we can do about it,” he says. “It’s not just about looking at interesting graphs—it’s about making data-driven decisions that affect profitability.”
By analyzing data trends, manufacturers can predict future performance, identify potential risks, and plan for growth. For example, they can determine which products are likely to become less profitable over time or identify areas where process improvements could significantly boost margins.
With predictive analytics, manufacturers can move from reactive to proactive decision-making, adjusting operations to optimize profit before issues arise.
Maximizing Profit through Incremental Improvements
Data analytics tools don’t just highlight the big wins—they also help manufacturers make incremental improvements that can lead to significant gains in profitability. Whether it’s fine-tuning pricing strategies, improving production efficiency, or reducing costs, small changes can have a large impact over time.
Fathom is a good example of this. With Fathom, manufacturers can create scenarios to explore different paths to reach the same goal.
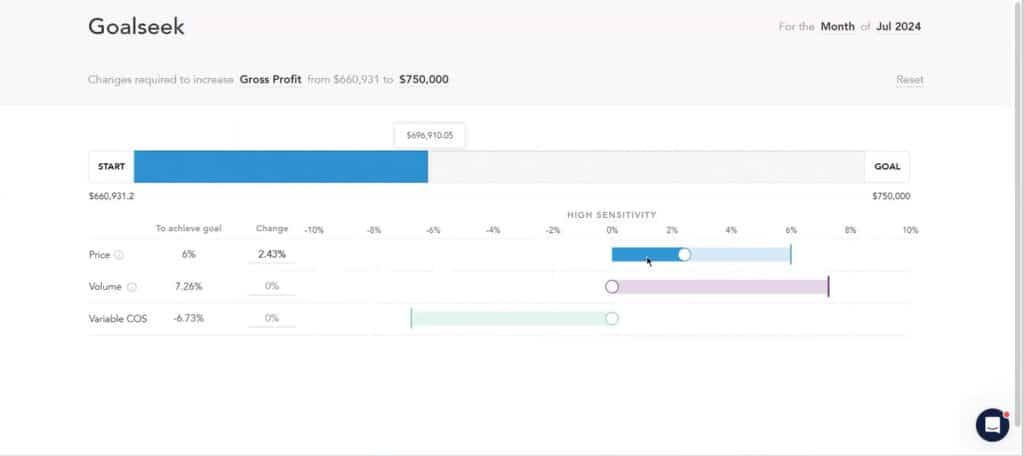
Select a target gross profit goal.
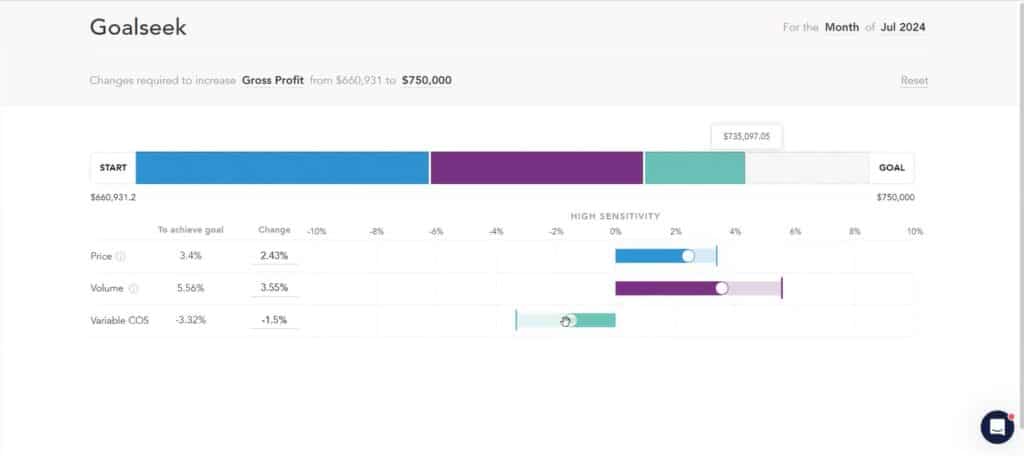
Adjust the levers of price, volume, and variable COS to determine how best to reach your goal.
The tool allows you to manipulate real manufacturing data by adjusting different levers that affect gross profit. You can adjust your product pricing, production, and variable costs by increments as small as 1% or 2% and see substantial improvements in gross profit. “It’s not just about big changes,” explains Rick. “These tools allow us to measure, test, and optimize even small tweaks in our operations.”
By using analytics to break down cost rates, manufacturers can make more informed decisions about pricing, production, and cost reduction—ensuring they are focusing on the most profitable aspects of their business.
Conclusion
The bottom line for manufacturers is clear: Data is a valuable asset, but it’s only as powerful as the insights you can extract from it. With the right tools in place, manufacturers can use data to improve profitability, optimize operations, and make smarter, more informed business decisions.
Resources like Chortek’s outsourced accounting and advisory practice can help your business leverage data analytics tools like Power BI, giving you a roadmap for driving profitability at every level of the organization.
Author Bio: Rick Sovitzky is a partner at Chortek and leads the outsourced accounting and advisory practice. With extensive experience in data analytics and financial advisory services, Rick specializes in helping manufacturers leverage technology to improve profitability and operational efficiency. He is passionate about using tools like Microsoft Power BI and Fathom to help businesses transform their data into actionable insights, driving growth and enhancing decision-making.
Suggested Reading:
Read the entire Manufacturing Forum: The Future of Profitability series.
Maximize Margins: ERP Best Practices for Profitable Manufacturing
Tax-Proof Your Profits: Strategic Tax Planning for Manufacturers
The Role of IT in Driving Manufacturing Profitability
M&A Trends in the Manufacturing Industry: Seizing Opportunities in a Changing Market